The Anthropic Prospectus Arrives: My (but not the) IPO valuation!
Musings on Markets is the personal blog of Aswath Damodaran, professor of finance at NYU Stern and widely known as the "Dean of Valuation." Running since 2008, it publishes hands-on intrinsic-value teardowns of headline companies (SpaceX, Tesla, Nvidia) using his narrative-and-numbers DCF framework, plus periodic market-wide reviews.
In plain words
Following Anthropic's S-1 filing, Aswath Damodaran attempts to interpret key disclosures from both optimistic and pessimistic perspectives across four valuation input dimensions: revenue growth, profitability, reinvestment, and risk. He argues that the prospectus is a snapshot of the past and that value depends on future expectations. Therefore, he constructs a story-driven valuation framework and allows readers to derive their own valuations by adjusting key assumptions. The author notes that Anthropic's revenue grew exponentially over the past year but slowed in the third quarter; operating losses narrowed and may have turned to profitability in the most recent quarter. However, the company faces massive compute commitments (over $650 billion), which increases operating leverage and financing risk. In terms of governance, Anthropic has established five classes of shares, with founders controlling 50.1% of voting rights through Class F shares. A public benefit trust has the power to elect a majority of the board, significantly weakening public shareholder power. Under his base-case assumptions, the author estimates Anthropic's equity value at approximately $1.475 trillion and emphasizes that the IPO price has not yet been determined. He cautions investors that if the pricing is far above his valuation, he would choose to stay out of the frenzy; however, he also believes there may be future opportunities when the market undervalues the company. The article concludes by providing a shared spreadsheet for readers to input their own assumptions and compare valuations.
At a Glance
- Core Issue: Aswath Damodaran, based on Anthropic's S-1 filing, constructs a valuation framework from four dimensions—revenue growth, profitability, reinvestment, and risk—allowing readers to adjust assumptions to derive their own valuation.
- Valuation Result: Under the author's base assumptions, Anthropic's equity value is approximately $1.475 trillion (about $447 per share), near the lower end of the $1.5–$2 trillion range discussed in the original text. The IPO price has not yet been set.
- Key Assumptions: The author assumes 2036 revenue near $1 trillion (Scenario A6), a target operating margin of 32.5% (Scenario B4), a sales-to-capital ratio of 3.00 (Scenario C4), a cost of capital of 9.74% (Scenario D1), a 10% probability of failure, and a regulatory impact reducing the margin by 5 percentage points to 27.5% (Scenario E2).
- Governance Risk: Anthropic has five classes of shares, with the founder controlling 50.1% of voting power through Class F shares. A public trust has the right to elect a majority of the board, significantly weakening public shareholders' power. The author describes this structure as "self-serving."
- Scenario Range: In the most pessimistic scenario, equity value is -$373 billion (the company cannot sustain operations); in the most optimistic scenario, equity value is $4.04 trillion. The author considers both extremes unlikely.
- Author's Stance: The author states he will keep an open mind and wait for the IPO pricing. If the price is far above his valuation, he will choose to stay out of the frenzy; however, he also believes there may be opportunities in the future when the market undervalues the company.
Key Disclosures from the S-1: A Dual Reading of Revenue, Profitability, Reinvestment, and Risk
Following Anthropic's S-1 filing on October 26, 2026, author Aswath Damodaran attempts to interpret the key disclosures from the prospectus across four valuation input dimensions—revenue growth, profitability, reinvestment, and risk—from both an optimistic and a pessimistic perspective. The author believes the prospectus is a snapshot of the past, and value depends on future expectations. Therefore, he constructs a story-driven valuation framework, allowing readers to arrive at their own valuation by adjusting key assumptions.
Revenue Growth and Composition
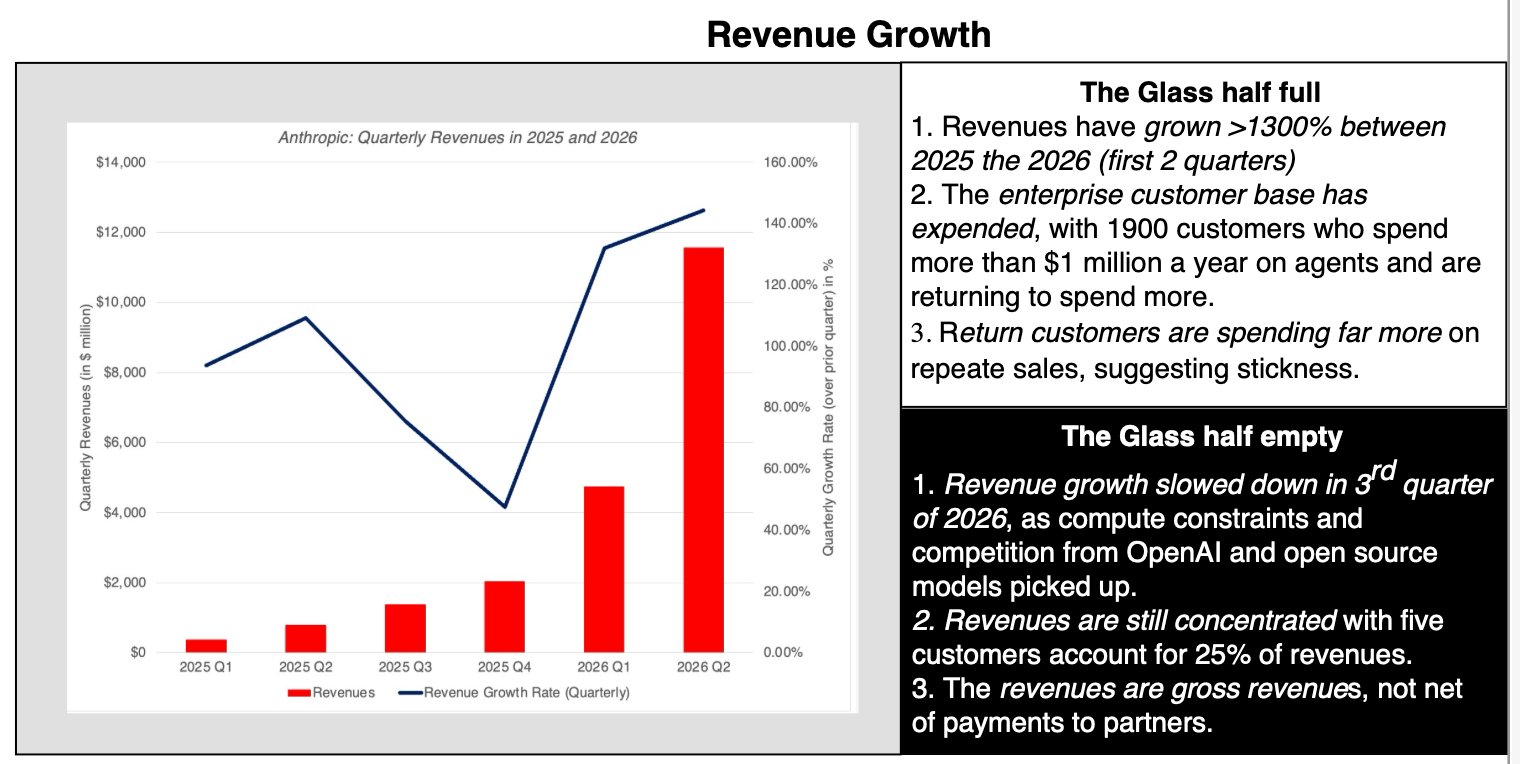
The author notes that Anthropic's revenue has grown exponentially over the past year, with revenue in the first two quarters of 2026 being approximately 14 times that of the same period in 2025. However, soberingly, revenue growth slowed in the third quarter of 2026, attributed to OpenAI's increased market share, computing power becoming a constraint, and some enterprises shifting to cheaper open-source models. Regarding customer composition, the number of enterprise customers spending over $1 million annually increased from fewer than 100 a year ago to 1,900, which is good news. The bad news is that revenue remains concentrated, with the top five customers accounting for 25% of total revenue.
Operating and Net Profit Margins
The author mentions that Anthropic reported an operating loss of over $80 billion in the first half of 2026 (adjusted for non-cash and one-time items). The actual reported loss was $800 billion, but $720 billion of that was a non-cash expense related to the conversion option of convertible bonds. The good news is that the trend line is improving, with the company claiming it achieved an operating profit in the most recent quarter. Over time, the company's efficiency in delivering revenue is also improving, with expenses as a percentage of revenue generally declining. The largest cost—computing power costs—dropped from over 250% of revenue to 48% (on a quarterly basis).
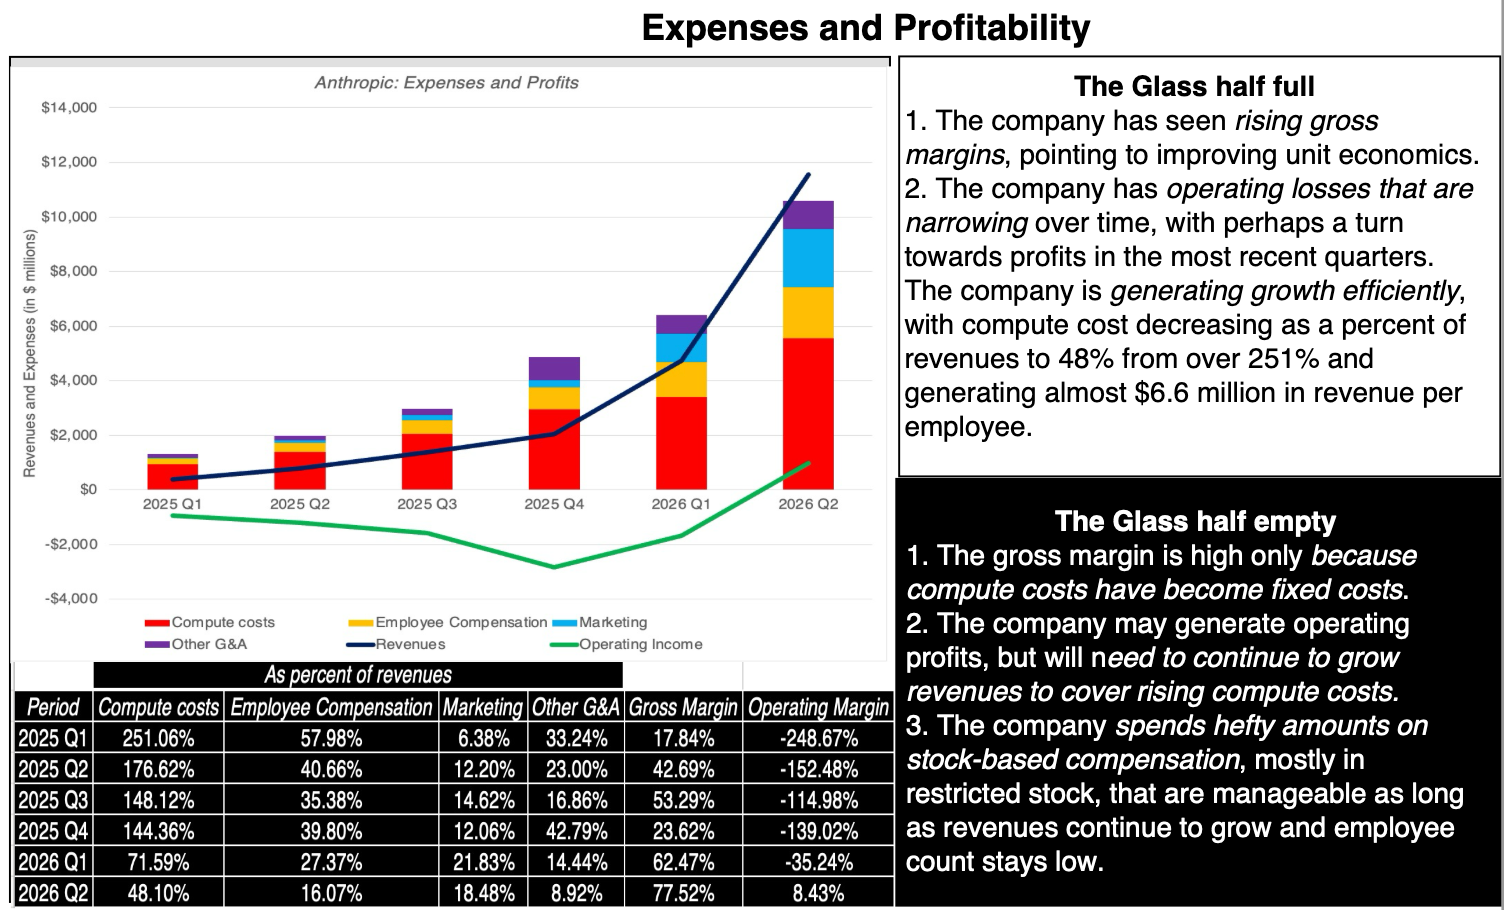
The following table is compiled from the original text's charts, with all items as a percentage of current period revenue:
| Period | Computing Cost | Employee Compensation | Marketing | Other G&A | Gross Margin | Operating Margin |
|---|---|---|---|---|---|---|
| 2025 Q1 | 251.06% | 57.98% | 6.38% | 33.24% | 17.84% | -248.67% |
| 2025 Q2 | 176.62% | 40.66% | 12.20% | 23.00% | 42.69% | -152.48% |
| 2025 Q3 | 148.12% | 35.38% | 14.62% | 16.86% | 53.29% | -114.98% |
| 2025 Q4 | 144.36% | 39.80% | 12.06% | 42.79% | 23.62% | -139.02% |
| 2026 Q1 | 71.59% | 27.37% | 21.83% | 14.44% | 62.47% | -35.24% |
| 2026 Q2 | 48.10% | 16.07% | 18.48% | 8.92% | 77.52% | 8.43% |
The optimistic view holds that rising gross margins indicate improving unit economics; operating losses are narrowing, with the most recent quarter potentially turning profitable; computing costs as a percentage of revenue fell from over 251% to 48%; and revenue per employee is approaching $6.6 million. The pessimistic view argues that high gross margins may be because computing costs have shifted to fixed costs; sustained revenue growth is needed to cover rising computing costs; and the scale of equity compensation (primarily restricted stock) and its controllability depend on continued revenue growth and maintaining a low employee count.
Growth Reinvestment
The author points out that AI agents are heavy consumers of computing power, and AI companies are investing heavily in it. Anthropic's financial statements currently do not show these investments—neither capital expenditures in the cash flow statement nor debt (and invested capital) on the balance sheet reflect significant computing power investments. However, the company's future computing commitments are public, reporting hundreds of billions of dollars in future commitments. The good news is that Anthropic is catching up to OpenAI, which leads in computing power. The bad news is that this catch-up is costly in terms of commitment expenses. Furthermore, computing power requires renewal and reinvestment. While chip costs (a key component) may decline, data centers facing community opposition could become more expensive.
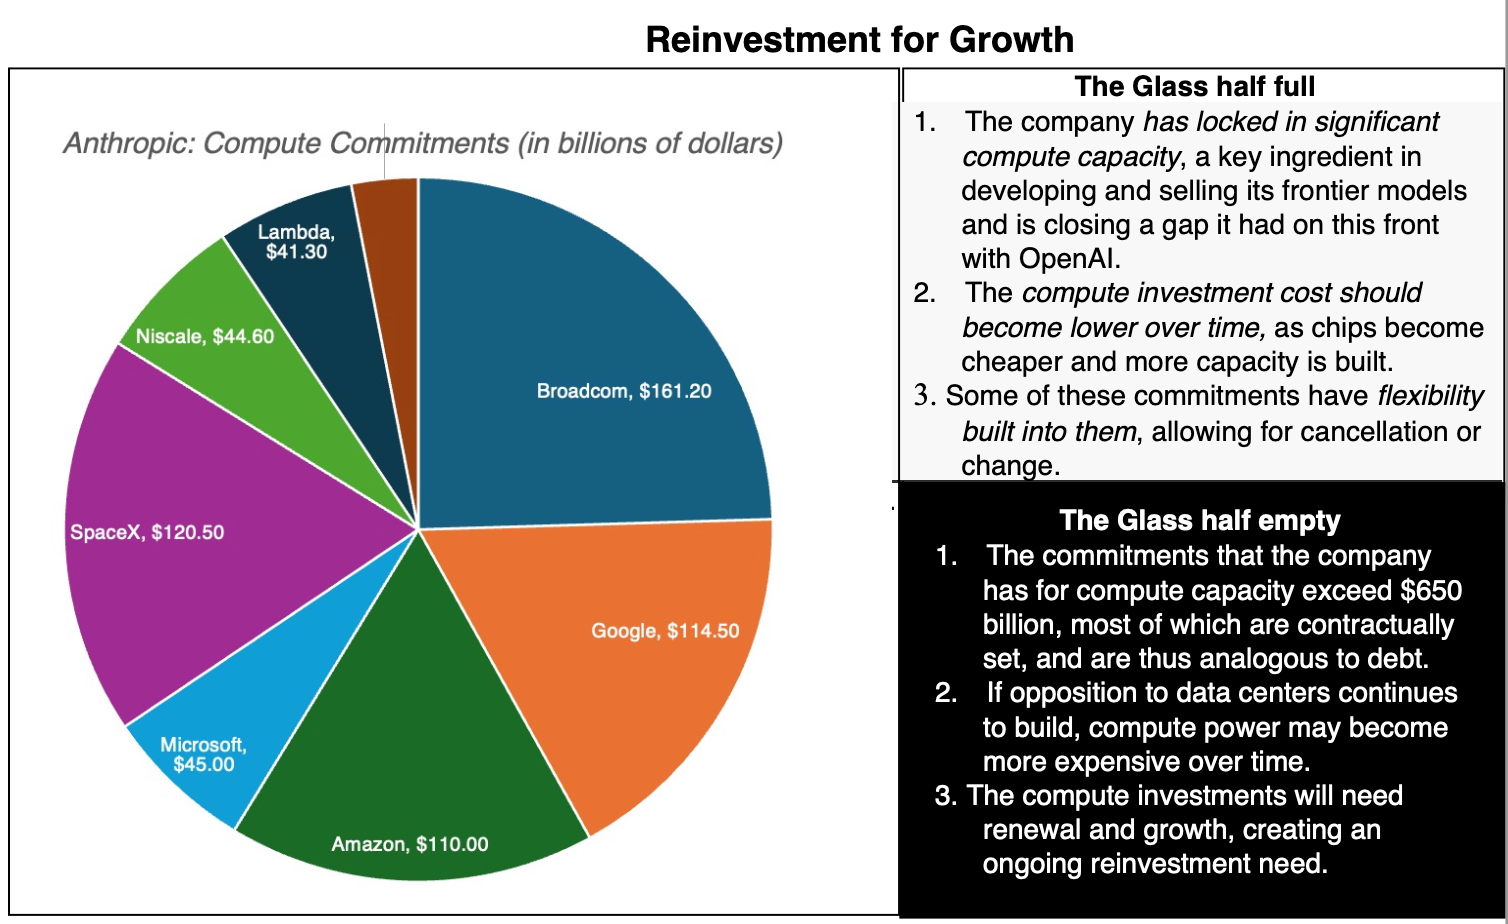
The supplier commitment amounts in the chart above are as follows, compiled from the original chart:
| Supplier | Commitment Amount (in billions of USD) |
|---|---|
| Broadcom | 161.20 |
| 114.50 | |
| Amazon | 110.00 |
| Microsoft | 45.00 |
| SpaceX | 120.50 |
| Niscale (original chart spelling) | 44.60 |
| Lambda | 41.30 |
| Unlabeled Sector | Name and amount not indicated |
The optimistic view suggests that locking in computing power narrows the gap with OpenAI; cheaper chips and supply expansion could lower input costs; and some commitments may be cancellable or adjustable. The pessimistic view argues that commitments exceed $650 billion, most contracts are fixed, resembling debt; resistance to data centers could raise costs; and computing investments require renewal and expansion, not a one-time outlay.
Operational and Regulatory Risks
The author notes that Anthropic's thesis is that once customers adopt the Claude model within their enterprises, it will become operationally indispensable, and customers will not abandon it (making revenue sticky and reducing business risk). However, this has not been fully validated. AI agent spending may be cyclical, and enterprises might cut spending during economic downturns. Regarding financing, committing to hundreds of billions of dollars in computing purchases and leases exposes the company to default risk (bond rating BB+). However, the company would argue that as a large, publicly listed company, its ability to access new capital will mitigate this risk. Furthermore, its cash balance has reached $114 billion, and the IPO could add another $100 billion, providing ample cash to cover commitments for the next few years.
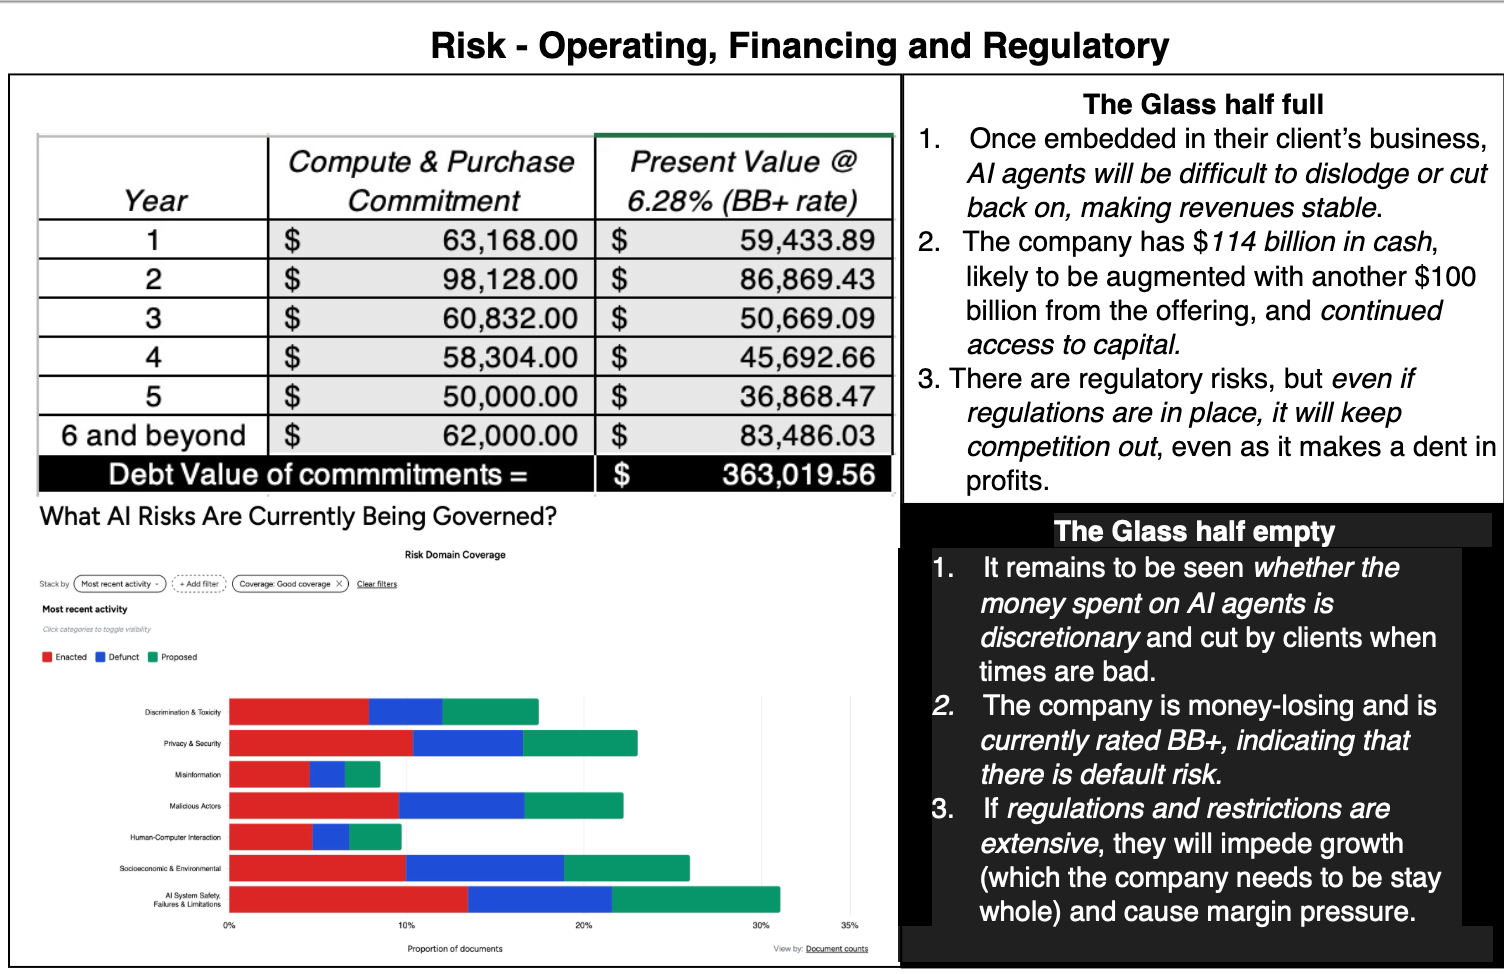
The chart above discounts computing and procurement commitments at 6.28% (the BB+ interest rate). The commitment amounts and present values for each year are as follows (units in the original chart are marked only with $, without explicitly stating millions or billions):
| Year | Original Table Commitment Amount | Original Table Present Value |
|---|---|---|
| 1 | 63,168.00 | 59,433.89 |
| 2 | 98,128.00 | 86,869.43 |
| 3 | 60,832.00 | 50,669.09 |
| 4 | 58,304.00 | 45,692.66 |
| 5 | 50,000.00 | 36,868.47 |
| Year 6 and beyond | 62,000.00 | 83,486.03 |
| Debt Value of Commitments | — | 363,019.56 |
The risk/regulation chart displays the proportion of documents by topic, with a legend for Enacted, Repealed, and Proposed. Topics include Discrimination & Toxicity, Privacy & Security, Misinformation, Malicious Actors, Human-Computer Interaction, Socioeconomic Environment, and AI System Safety Failures & Limitations. The optimistic view holds that embedding in customer businesses stabilizes revenue; cash is $114 billion, with the IPO potentially adding another $100 billion; and regulation could simultaneously block new competition. The pessimistic view argues that customers may cut AI spending in a poor environment; the company is loss-making with a BB+ rating, facing default risk; and broad restrictions could suppress growth and margins.
Author's Summary of Prospectus Information
The author believes the useful information in the prospectus will satisfy neither bulls nor bears. He summarizes the following points:
- The company's revenue is growing rapidly, at least for its core user base, and it is delivering on its promises. However, the revenue growth rate has clearly declined, constrained by scale, competition, and computing power. Furthermore, Anthropic's high degree of interconnection with other major AI players in operations and financing practices (the circularity often mentioned by critics) could indeed lead to double-counting and opacity.
- Various expenses are growing slower than revenue, helping to reduce operating losses and moving the company not just toward profitability, but toward significant profitability. However, despite reporting a profit in one quarter, the company is not yet fully profitable and requires significant revenue growth to stay ahead of expenses (stemming from computing commitments) in future periods.
- The massive computing commitments not only lock in the growth needed but are also the primary reason for the reported high gross margins, as the company has shifted its largest expense from a variable cost to a fixed operating cost. However, this comes at a cost, not only increasing operating leverage but also generating future commitments as computing power needs replenishment and growth.
- Anthropic has built a risk buffer with a massive cash balance, which will increase post-IPO, and customers may become dependent on its products, making revenue stickier. However, the company faces risks in three dimensions: operationally, high operating leverage; financially, contractual content cost commitments; and for survival, dependence on growth to meet its obligations.
The author concludes by cautioning against being drawn into conspiracy theories (that hyperscalers, chipmakers, and LLMs are jointly creating an illusion of AI success to deceive investors) or accounting fraud stories surrounding AI companies. He acknowledges that self-interest drives many actions in this field and that accountants sometimes use the discretion in accounting standards to make numbers look more favorable. However, these are problems common to all companies, not unique to AI and Anthropic, and falling into conspiracy theories can hinder consideration of other explanations.
Valuation Story and Inputs: Revenue, Margins, Reinvestment, and Risk Assumptions
Author Aswath Damodaran argues that while a prospectus discloses a wealth of information, it is ultimately a document rooted in the past, whereas a company's value depends on your expectations for the future. Therefore, he plans to leave the safe harbor of historical disclosures and venture into forecasting the future, fully aware that his predictions may be wrong, perhaps even spectacularly so. At each step of the story, he provides the reader with the opportunity to disagree with his view and input their own assumptions, thereby changing the valuation inputs.
1. The Story of Scalable Growth
The value of Anthropic (and, by extension, all future AI product and service companies) ultimately depends on how large you believe the market for AI products and services will be, and what share of that market your company can capture. The author discussed this when evaluating the AI business a few months ago and believes the total addressable market (TAM) for AI products and services depends on four judgments:
- Is AI a productivity tool for employees or a replacement for employees? The latter creates a larger market.
- Does this employee replacement primarily occur in high-wage brackets (top 20%) or across the board? The latter pushes up the total market.
- Is AI's impact concentrated in a few industries, or does it span many or most industries? The market expands as AI's reach extends.
- Does AI's disruption occur mainly in the US and a few regions, or is it global? A global impact leads to a larger market.
The author illustrates the potential range of the total market size with the following chart:
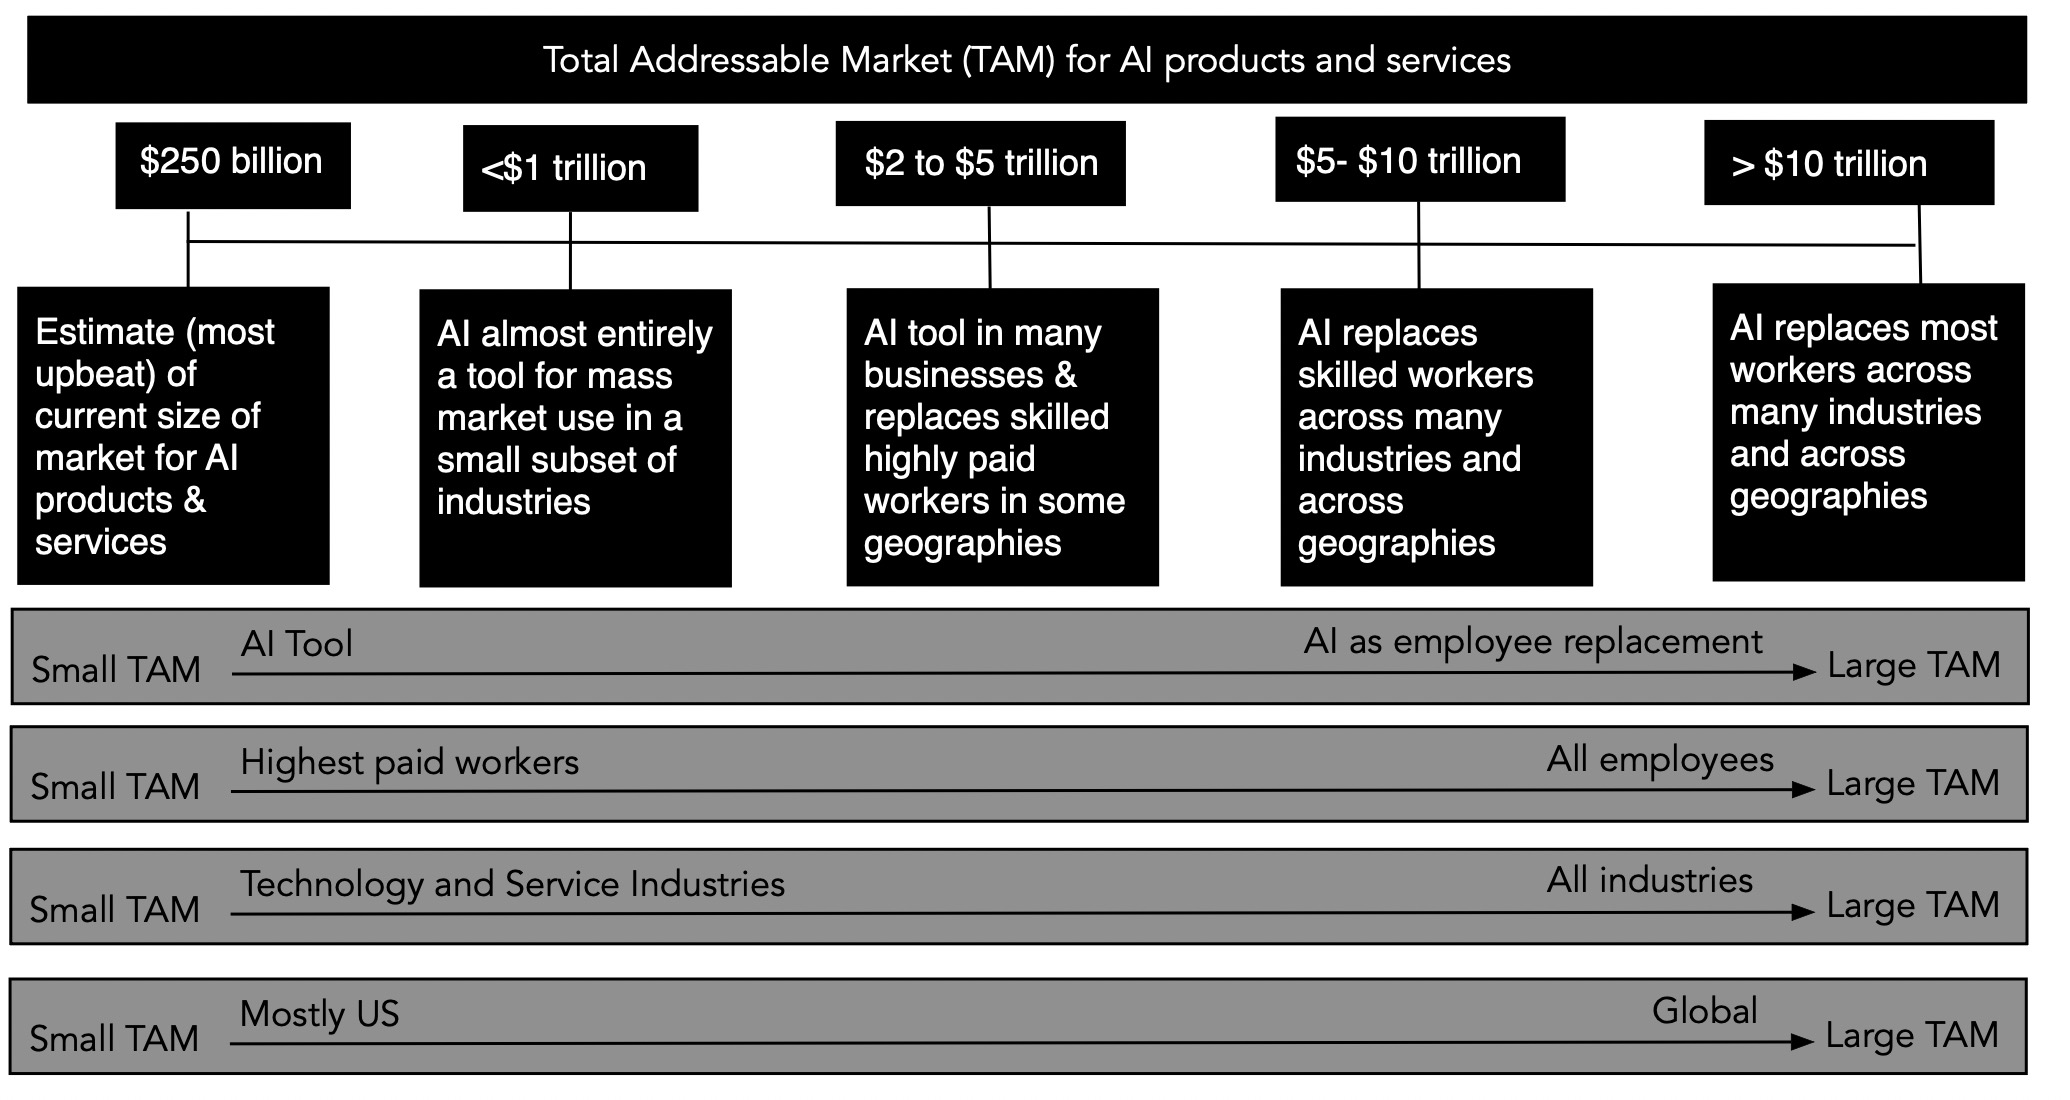
AI Product & Service Total Addressable Market (TAM) Scenario Framework
| Size | Corresponding Scenario |
|---|---|
| $250 billion | Most optimistic estimate of market size at the time |
| Below $1 trillion | AI is almost exclusively a mass-market tool in a few industries |
| $2 trillion to $5 trillion | A tool across many industries, replacing high-skill, high-wage labor in some regions |
| $5 trillion to $10 trillion | Replaces skilled labor across industries and geographies |
| Over $10 trillion | Replaces most labor across industries and geographies |
Note: The four dimensions, from smallest to largest, are: AI tool → employee replacement; highest-paid workers → all employees; tech and services → all industries; primarily US → global. This is a scenario framework, not all sizes are realized.
The author believes that AI will have the power to disrupt some industries, and its most powerful (and highest-priced) models will replace white-collar (high-wage) employees, thereby creating a terminal market of $5 trillion or more for its products. Based on his initial reading of the current AI business, he believes Anthropic is targeting the premium segment and appears to be the leader in that market. Furthermore, the prospectus explicitly states Anthropic's ambition to become a competitor in the businesses its agents are disrupting, with pharmaceuticals being a potential direction. This implies that Anthropic Pharma (or whatever name they choose) would use its agents for drug discovery and testing, replacing companies currently offering these services, and capturing at least a portion of the revenue from the drugs it develops.
Based on this narrative, the author believes it is reasonable for Anthropic's revenue to approach $1 trillion within a decade. For context, no company in the world currently generates over $1 trillion in revenue; Amazon and Walmart have revenues around $700 billion to $750 billion (though in current dollars and at that point in time).
The author provides different revenue scenarios for the reader to choose from:

2036 Revenue Scenarios and Year 2-5 CAGR
| Option | 2036 Revenue ($ billion) | Year 2-5 CAGR |
|---|---|---|
| A1: AI as a Tool | 200 | 9.00% |
| A2: AI Replaces Jobs in Future | 500 | 26.80% |
| A3: Selective Job Replacement | 800 | 36.71% |
| A4: Broad Job Replacement | 1,200 | 46.00% |
| A5: AI as Industry Player | 1,500 | 51.25% |
| A6: Direct CAGR Input & Check Year 10 Revenue (highlighted row) | 1,011 | 42.00% |
Note: The left total title reads "in $ millions," while the value column header reads "$ billion" and each scenario text also says "billion." This transcription uses the explicit value column and records the original chart's title discrepancy.
The author's choice is the highlighted row (A6). He advises readers that when choosing, they should focus more on the target revenue they believe Anthropic can achieve in 2036, rather than the compound annual growth rate for years 2-5, the latter being merely an input to achieve that target revenue.
2. The Story of Profitability
The prospectus clearly shows a trend towards profitability, but after Anthropic's growth pains subside, at what level will its profit margins ultimately stabilize? To estimate where margins will converge, the author argues one must first recognize that the AI product and service market, once established, may split into two parts: a mass market segment, where many potentially open-source and less capable AI agents and models will compete primarily on price; and a premium segment, where frontier models (many of which will remain closed-source and driven by customer data) will dominate. The operating margins for the former are more likely to resemble business services (around 10%), while the margins for the latter will converge towards enterprise software (top quartile near 40%), with computing power and R&D being the reinvestments needed to deliver these products.
Anthropic is targeting the premium segment, evidenced not only by its current revenue structure (nearly 80% from usage-based enterprise customers) but also by its focus on using newly acquired computing power to build the next generation of models, rather than servicing existing customers. The author assumes a final revenue mix of 75% from premium products and 25% from the mass market, resulting in an unadjusted pre-tax operating margin of 32.5%; this would place Anthropic at the 90th percentile of US companies in 2026.
Readers can offer different opinions on the market mix, the margins for each segment, or the economics of scaling the business:

Target Operating Margin in 2031 Corresponding to Market Mix
| Market Mix Option | Target Operating Margin |
|---|---|
| B1: 100% Mass Market | 10.00% |
| B2: 75% Mass, 25% Premium | 17.50% |
| B3: 50% Mass, 50% Premium | 25.00% |
| B4: 25% Mass, 75% Premium (highlighted) | 32.50% |
| B5: 100% Premium | 40.00% |
| B6: Direct Input | 30.00% |
Note: This input reflects margin pressure from open-source models; the greater the pressure, the closer to mass market margins. This is not a realized company margin.
The author's estimate for the target margin is the highlighted B4 (32.50%), but he acknowledges ample room for different choices.
3. The Story of Reinvestment
The core of the reinvestment assumptions for Anthropic lies in understanding computing power—how it is created and how much is needed as frontier models become more powerful and scale. Currently, Anthropic has over $600 billion in computing commitments, indicating it views computing power as necessary to achieve its growth ambitions and maintain an edge over competitors (existing and potential).
The nature of computing power, especially the chips that constitute a large portion of the cost, means investments age quickly and need replacement. This suggests that if Anthropic's growth ambitions are realized, even more reinvestment will be needed in the coming years to replenish and expand computing capacity. Admittedly, technology could make chips cheaper, but this might be offset by the proportional increase in computing demands of new models. Adding in the real estate and power needs of data centers, there is disagreement on how much additional investment is required in the future. The author believes computing constraints will persist in the short term but ease over time. This belief translates into his assumption that for every $3 increase in revenue, Anthropic will need to invest about $1. This is comparable to the revenue generated per dollar of invested capital for today's tech companies, but given Anthropic's projected revenue leap, it translates into massive annual dollar reinvestment.
Readers can make different choices regarding computing cost scenarios:

Computing Cost Scenarios and Sales-to-Capital Ratio (First 5 Years)
| Option | Sales-to-Capital Ratio (First 5 Years) |
|---|---|
| C1: Computing persistently scarce and expensive | 1.00 |
| C2: High near-term costs, moderate later | 1.50 |
| C3: High near-term costs, easing later | 2.50 |
| C4: Near-term costs ease (highlighted) | 3.00 |
| C5: Computing abundant and cheap | 4.00 |
| C7: Direct Input (original numbering) | 4.00 |
Note: Reinvestment is primarily for computing power; the amount depends on computing costs.
The author's base assumption is the highlighted C4 (Sales-to-Capital ratio of 3.00). He cautions that a lower sales-to-capital ratio would make the business more capital-intensive and increase the cash consumption for reinvestment.
4. The Story of Risk
As an investor in Anthropic, the risks you face are not only numerous but also diverse. To organize his thoughts, the author groups risks into three categories:
a. Operating Risk: The AI business is still evolving, and while Anthropic's current growth and customer stickiness are notable, it will face challenges as the business grows and navigates market and economic turbulence. For example, for customers using AI as a productivity tool, we don't know if or how much they will cut spending during an economic downturn; for customers planning to replace employees with AI agents, the speed and extent of adoption may vary with economic conditions. The number used to incorporate this risk into the valuation is the cost of capital. For Anthropic, assuming it bears the risk of large technology companies, plus the additional burden of computing commitments, the author estimates its cost of capital at 9.74%. For context, in September 2026, the median cost of capital for US companies was 9.16%, and the third quartile was 9.88%.
Readers can choose a different initial cost of capital:

Initial Cost of Capital Options
| Option | Cost of Capital |
|---|---|
| D1: Company-Specific Input (highlighted) | 9.74% |
| D2: Tech Industry Median | 9.34% |
| D3: All Companies, First Quartile | 7.79% |
| D4: All Companies, Median | 9.16% |
| D5: All Companies, Third Quartile | 9.88% |
| D6: Direct Input | 10.00% |
Note: AI services span multiple businesses; the author believes the cost of capital should not be extremely high. Regulatory risk can be reflected in margins, and lease commitments can be reflected in failure risk.
The author's advice is not to spend too much time fine-tuning the cost of capital, as it is one of the least critical assumptions among the many driving the valuation.
b. Financing Risk: Many bears on Anthropic focus primarily on its hundreds of billions of dollars in computing commitments, which create fixed costs that, especially if revenue growth falls short, will become a drag on profitability and introduce distress risk. While bondholders have reason for concern and point to the company's current BB+ bond rating as evidence, two factors mitigate the failure risk. First, the company has sufficient cash balances to sustain near-term operations and meet contractual obligations. Second, as a high-profile, multi-trillion-dollar market cap public company, it will have access to capital. However, the author argues that if revenue growth falters, both advantages will disappear, as cash will be depleted and the market cap will collapse. He estimates a 10% probability of failure, with a loss of half the value in the event of failure.
Readers can input their own failure probability and recovery rate in the provided spreadsheet:

Note: The figure shows the initial default assumption as "No failure probability in the foreseeable future"; the author overrides this, setting a 10% failure probability and a 50% recovery rate of book or fair value upon failure.
c. Regulatory Risk: For AI companies, the question of regulatory risk is not whether it will come, but when and in what form. Both Anthropic and OpenAI have invited governments to restrict how this business develops, and while a cynical interpretation of these requests is that it could stifle competition (especially from China), regulation and restrictions are coming. As with large social media companies, the impact of these regulations will not be a cessation of business, but rather increased operating expenses and lower profit margins. The author estimates the regulatory impact to be relatively mild, reducing his initial operating margin estimate for Anthropic from 32.5% to 27.5% (a reduction of 5 percentage points).
Readers can make their own judgment on the impact of regulation on margins:

Adjustment to Target Operating Margin from Regulation
| Option | Margin Adjustment |
|---|---|
| E1: No Impact | 0% |
| E2: Mild Constraints (highlighted) | -5.00% |
| E3: Moderate Constraints | -10.00% |
| E4: Strict Constraints | -15.00% |
| E5: Direct Input (yellow input cell) | -7.50% |
Note: Regulation is reflected through higher costs, lower operating margins, and growth impact. The highlighted E2 is the author's chosen scenario; the yellow direct input cell should not be mistaken for the author's choice. The text explicitly states an adjustment from 32.5% to 27.5%, which should be expressed as a reduction of 5 percentage points, not a multiplication by 95%.
The author acknowledges that readers may disagree with his assessment of the likelihood and impact of regulation. His base case is the highlighted E2 (-5.00%), but readers can make different choices.
The Author's Valuation Results and Scenario Comparison
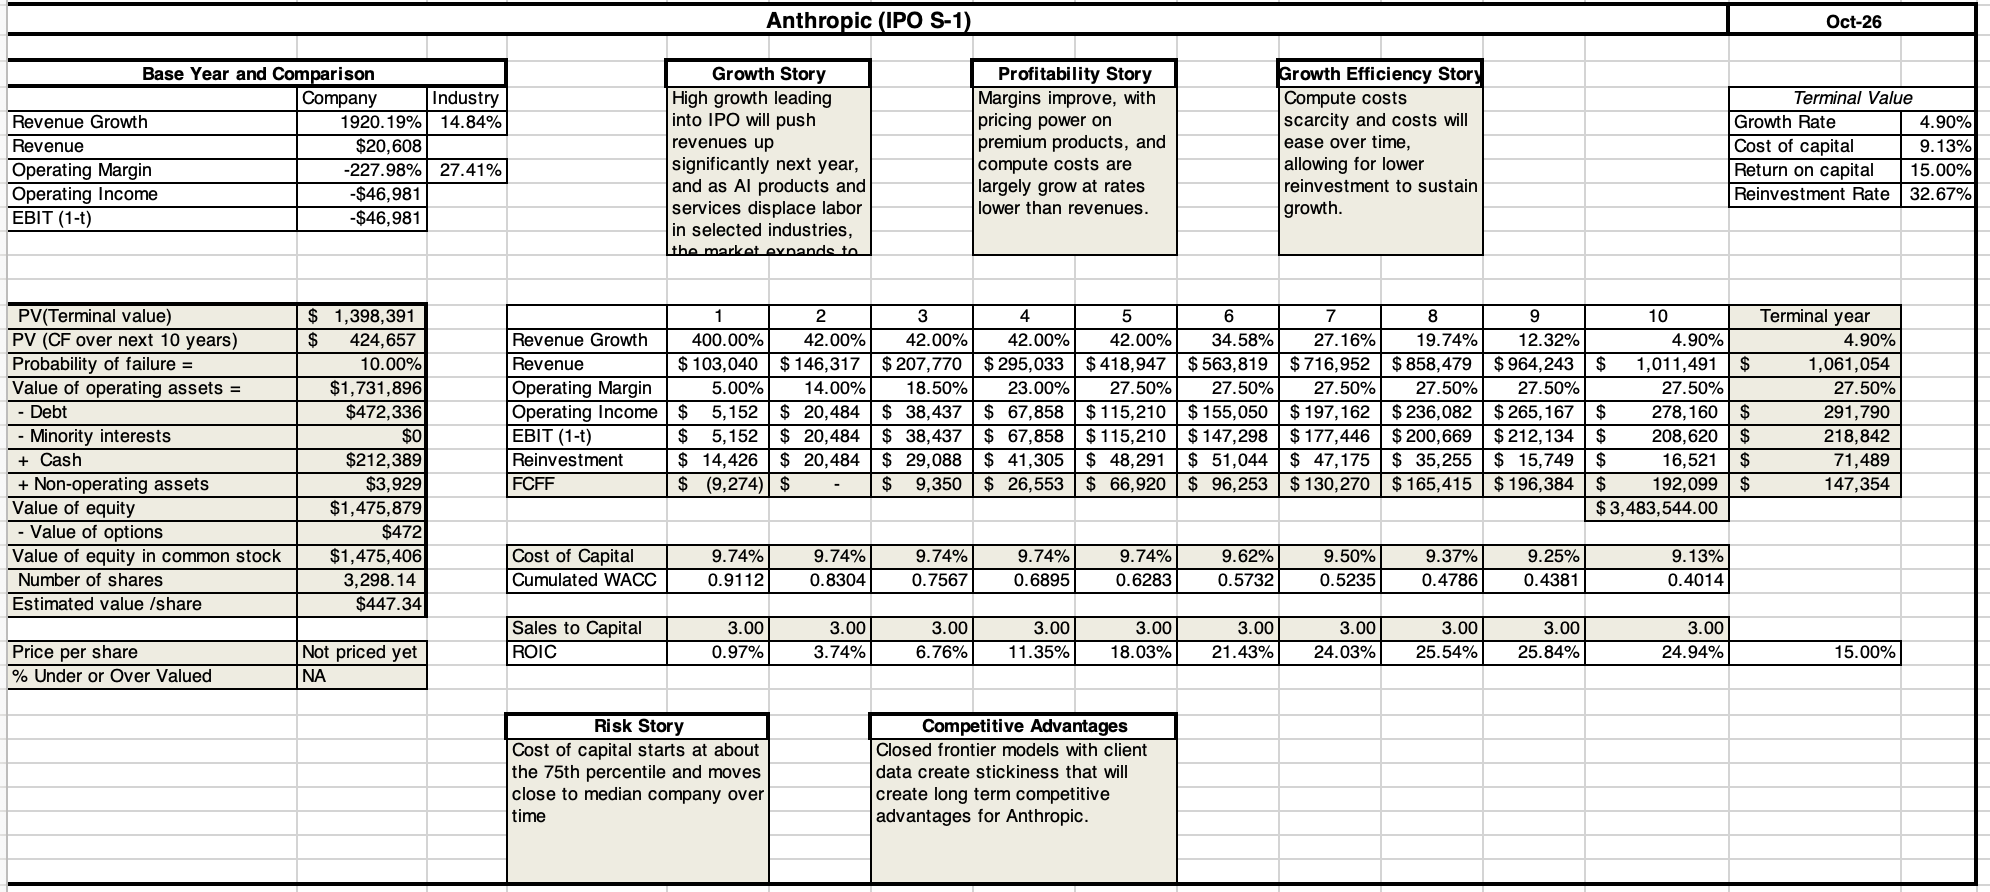
Under this set of optimistic operating and risk assumptions, the author estimates Anthropic's equity value to be approximately $1.475 trillion, near the lower end of the $1.5 to $2 trillion range discussed in the text; the valuation table also notes that the offering price has not yet been determined. The cash assumption includes approximately $100 billion in IPO proceeds. There is a conflict in the order of magnitude between the debt amount stated in the text and that in the valuation table, as explained below.
The following is the core data from the author's valuation model, divided into three sections: operating forecasts, cash flows and discounting, and the equity value bridge. All amounts retain the displayed values from the original table. The original chart does not explicitly note the unit of magnitude for the amounts, but the author interprets the equity value in the text as approximately $1.475 trillion.
Operating Forecasts (Base Year, Years 1–10, and Terminal Year)
In the base year comparison, the original table lists an industry revenue growth rate of 14.84% and an operating margin of 27.41%.
| Year | Revenue Growth Rate | Revenue | Operating Margin | Operating Profit | EBIT(1-t) | Reinvestment | Sales/Capital Ratio |
|---|---|---|---|---|---|---|---|
| Base Year | 1920.19% | 20,608 | -227.98% | -46,981 | -46,981 | — | — |
| 1 | 400.00% | 103,040 | 5.00% | 5,152 | 5,152 | 14,426 | 3.00 |
| 2 | 42.00% | 146,317 | 14.00% | 20,484 | 20,484 | 20,484 | 3.00 |
| 3 | 42.00% | 207,770 | 18.50% | 38,437 | 38,437 | 29,088 | 3.00 |
| 4 | 42.00% | 295,033 | 23.00% | 67,858 | 67,858 | 41,305 | 3.00 |
| 5 | 42.00% | 418,947 | 27.50% | 115,210 | 115,210 | 48,291 | 3.00 |
| 6 | 34.58% | 563,819 | 27.50% | 155,050 | 147,298 | 51,044 | 3.00 |
| 7 | 27.16% | 716,952 | 27.50% | 197,162 | 177,446 | 47,175 | 3.00 |
| 8 | 19.74% | 858,479 | 27.50% | 236,082 | 200,669 | 35,255 | 3.00 |
| 9 | 12.32% | 964,243 | 27.50% | 265,167 | 212,134 | 15,749 | 3.00 |
| 10 | 4.90% | 1,011,491 | 27.50% | 278,160 | 208,620 | 16,521 | 3.00 |
| Terminal Year | 4.90% | 1,061,054 | 27.50% | 291,790 | 218,842 | 71,489 | — |
Cash Flows, Discounting, and Terminal Value
| Year | FCFF | Cost of Capital | Cumulative Discount Factor | ROIC |
|---|---|---|---|---|
| 1 | -9,274 | 9.74% | 0.9112 | 0.97% |
| 2 | Horizontal line in chart | 9.74% | 0.8304 | 3.74% |
| 3 | 9,350 | 9.74% | 0.7567 | 6.76% |
| 4 | 26,553 | 9.74% | 0.6895 | 11.35% |
| 5 | 66,920 | 9.74% | 0.6283 | 18.03% |
| 6 | 96,253 | 9.62% | 0.5732 | 21.43% |
| 7 | 130,270 | 9.50% | 0.5235 | 24.03% |
| 8 | 165,415 | 9.37% | 0.4786 | 25.54% |
| 9 | 196,384 | 9.25% | 0.4381 | 25.84% |
| 10 | 192,099 | 9.13% | 0.4014 | 24.94% |
| Terminal Year | 147,354 | 9.13% | — | 15.00% |
Terminal value assumptions: growth rate 4.90%, cost of capital 9.13%, return on capital 15.00%, reinvestment rate 32.67%. The terminal value amount below Year 10 is 3,483,544.
Equity Value Bridge
| Item | Amount |
|---|---|
| PV of Cash Flows for Next 10 Years | 424,657 |
| PV of Terminal Value | 1,398,391 |
| Operating Asset Value After Failure Probability (10%) Adjustment | 1,731,896 |
| Less: Debt | 472,336 |
| Less: Minority Interests | 0 |
| Plus: Cash | 212,389 |
| Plus: Non-Operating Assets | 3,929 |
| Equity Value | 1,475,879 |
| Less: Option Value | 472 |
| Common Equity Value | 1,475,406 |
| Number of Shares (as displayed in original table) | 3,298.14 |
| Per Share Valuation | $447.34 |
> Note on Original Text Discrepancy: The text states debt is "close to $500 million," while the valuation chart shows 472,336 for debt; the equity value of 1,475,879 in the same table corresponds to approximately $1.475 trillion in the text. There is a conflict in the order of magnitude between these two debt statements. The original text and table are retained here without guessing missing units or altering the author's numbers.
Scenario Analysis: The Most Optimistic and Most Pessimistic Stories
The author believes that both bullish and bearish investors can arrive at their desired valuation by adjusting his assumptions. To avoid this "game," he encourages readers to make their own choices across four dimensions: revenue growth, margins, reinvestment, and risk. Based on this, he presents the valuation range under two extreme scenarios:
- Most Pessimistic Scenario: Target revenue reaches only $200 billion by 2036, margins converge to mass-market levels (10%), computing power remains scarce and expensive (Sales/Capital ratio of 1), the cost of capital rises to the third quartile of US companies (9.88%), and regulation has a massive negative impact on margins. Under this scenario, the equity value is -$373 billion, and the company is not a going concern.
- Most Optimistic Scenario: Target revenue soars to $1.5 trillion by 2036, margins reach high-end market levels (40%), computing power becomes cheap (Sales/Capital ratio of 4), the cost of capital falls to the first quartile of US companies (7.79%), and there is no regulatory impact. Under this scenario, the equity value is $4.04 trillion.
The author considers these two extreme scenarios possible but unlikely. He encourages readers to use the "3P Test" (Possibility, Plausibility, Probability) to evaluate their own story and corresponding valuation, and to make investment decisions based on their own judgment. The author also created a shared spreadsheet for readers to input their own assumptions and compare their valuations with others.
Corporate Governance and Lock-Up Periods: How Five Share Classes and Public Benefit Status Affect Shareholder Power
Author Aswath Damodaran argues that the core of corporate governance lies in the power of shareholders (for public companies) or outside investors (for private companies) to change how a company is run when they are dissatisfied with current management. However, through two key design features, Anthropic has weakened this power to an extreme, leading the author to remark that its "self-serving design would make Kim Jong-un envious."
The author also emphasizes that governance scores cannot substitute for an assessment of real shareholder power. Formal metrics such as board size, tenure, and member composition can be catered to or even manipulated by companies, making it difficult for scores to reflect whether shareholders can drive change. A board willing to challenge the CEO and actively engaged shareholders can enhance this power, while rules that restrict shareholder action weaken it.
Five Share Classes: Founders Lock in Control with 50.1% Voting Rights
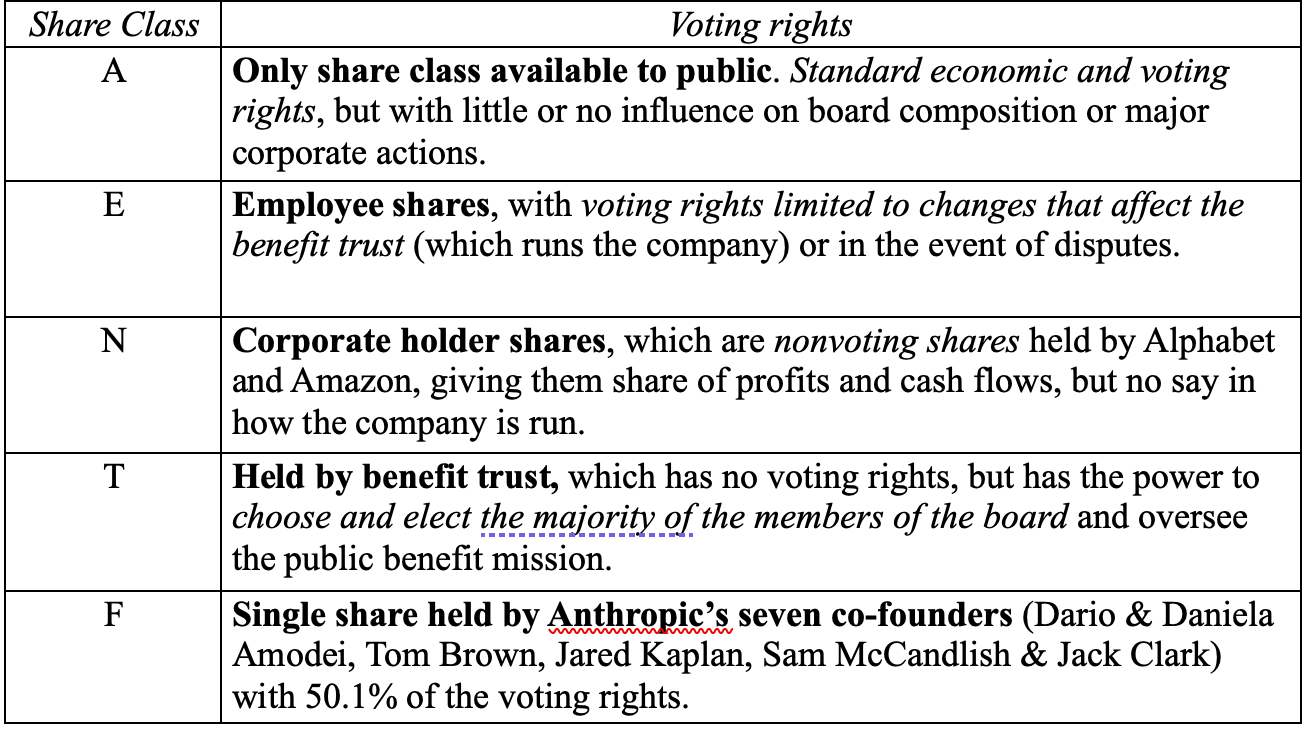
Anthropic has established as many as five share classes, each with different voting rights. The author points out that while Class A shares, which are open to the public, have standard economic and voting rights, the overall voting structure effectively "emasculates" the power of public investors.
| Share Class | Description from Original Source |
|---|---|
| A | The only class open to the public; standard economic and voting rights, but little to no influence over board composition or major corporate actions |
| E | Employee shares; voting rights are limited to changes or disputes affecting the public benefit trust that manages the company |
| N | Non-voting corporate shareholder shares held by Alphabet and Amazon; can share in profits and cash flows, but have no say in company operations |
| T | Held by the public benefit trust; no ordinary voting rights, but has the right to select and elect a majority of the board and oversee the public benefit mission |
| F | A single share held jointly by seven co-founders, carrying 50.1% of voting rights; the original source's parentheses list Dario and Daniela Amodei, Tom Brown, Jared Kaplan, Sam McCandlish, Jack Clark |
The author emphasizes that regardless of how many shares are issued in the future, the founders will always control 50.1% of the voting power through the Class F share, while the public benefit trust (Class T shares) has the right to elect a majority of the board. This means public shareholders have virtually no say in major corporate decisions.
The Author's Critique of the Public Benefit Corporation Status
Anthropic has registered itself as a public benefit corporation. The author quotes a statement from the prospectus: "We may make decisions that we believe appropriately balance the pecuniary interests of stockholders, the best interests of those materially affected by our actions, and the company's purpose, but these decisions may negatively impact the short-, medium-, or long-term performance of our business or market price."
The author argues that this structure does not protect society from the potential harms of AI but instead concentrates power in the hands of a few (the founders and their chosen public benefit trust members), relying on the hope that they will use that power wisely. For investors who have experienced corporate management engaging in self-serving behavior under the guise of corporate responsibility and ESG, Anthropic's structure is an "enhanced version."
Lock-Up Provisions: The Author Sees Limited Impact
Anthropic's IPO allows some investors to cash out on the first day of trading, which differs from many other IPOs. Specifically, on the first day of listing, insiders (excluding founders and certain key individuals) can sell up to 10% of their holdings. The remaining shares will be unlocked in tranches over the 180 days following the listing, while founders and key individuals must wait 365 days before they can trade.
The author is relatively calm about this. He believes market concerns about share unlocks are overblown. For a company like Anthropic, with large institutional investors and ample liquidity, the impact of unlocks may be muted. His view also reflects a belief that the "smart money" selling at unlock is not as smart as people think, and the informational value of their selling is far lower than commonly assumed.
The Author's Judgment: A "Provocation" to Institutional Investors
The author concludes that Anthropic's design of its corporate governance and lock-up provisions seems to be a provocation to institutional investors: either choose not to participate in the IPO to voice opposition, or remain passive. The author speculates that Anthropic has calculated that institutional investors will choose the latter.
The author admits that as an investor who also holds shares in companies with dual-class structures like Alphabet and Meta, he will not draw a hard line and claim he would never invest in such companies. However, he believes that by combining a public benefit corporation structure (which gives the company legal permission to use investor funds almost as it pleases) with an extremely self-serving voting rights design, Anthropic has made companies like Alphabet and Meta look tame in comparison.
The Author's Views on IPO Pricing, Valuation, and Participation Conditions
The author reiterates a view expressed in a prior article on Anthropic: the company will be priced at its IPO, and nearly everyone trading the stock immediately after listing will be pricing, not valuing. The author notes this is not a criticism but a realistic reminder for investors, especially those who seem to believe the market owes them a return simply for focusing on fundamentals. The author states the market owes no participant anything, and as an investor, he must recognize this reality and act accordingly.
Therefore, the author says he will keep an open mind and wait for Anthropic's IPO pricing. If the pricing is far above his estimated $1.48 trillion, he will choose to stay out of the frenzy. When asked why he wouldn't short the stock if the pricing is far above his valuation, the author responds that while he is confident in his valuation (despite a range), he has no reason to believe the market will or should agree with him, and even if the market is wrong, it may not correct within his time frame.
Once Anthropic begins trading, its story will continue to evolve and change. Given AI's presence in the economy and markets, the author guarantees it will be a roller-coaster ride. The author believes it is possible the market is underestimating AI's potential returns, and Anthropic's market cap could rise further; but it is equally possible that major parts of the narrative—from revenue growth to margins to risks—will face pressure, leading the market to reassess its pricing of Anthropic. Obviously, these pressures would also cause the author's estimate of value to change. At the time, the author judged that there would still be moments when Anthropic is undervalued by the market, and he believes this point may come sooner than expected; this is his personal judgment. The author cites the example of Facebook's IPO in June 2012: he thought the $36 stock price was overvalued, but just three months later, when the stock fell to $18, it became a bargain, making him a buyer. The author believes Anthropic's structure—a public benefit corporation facade and the abuse of voting rights—will require a larger discount in its value estimate, but the market may also meet that requirement.
The original text includes the following materials for verifying the author's model and disclosure basis:
- [Anthropic's S-1 filing submitted on October 26, 2026](https://www.sec.gov/Archives/edgar/data/2130357/000162828026067168/anthropicpbc-sx1.htm)
- [The author's Anthropic IPO valuation spreadsheet (Excel)](https://pages.stern.nyu.edu/~adamodar/pc/blog/AnthropicIPO.xlsx)
- [A shared Google Sheet for readers to fill in valuation assumptions](https://docs.google.com/spreadsheets/d/1oux4pQo8bLnx5tvVH25j8yCXrFK0_5qviiAzuXqk-Fg/edit?usp=sharing)
The original text also lists the author's extended articles on AI and SpaceX from 2026.
Full Target Movement Table
| Target | Role in the Text | Original View or Function | Key Data and Metrics |
|---|---|---|---|
| Anthropic | Subject of analysis | The author conducted a valuation analysis based on its S-1 prospectus, estimating an equity value of approximately $1.475 trillion | Revenue in the first two quarters of 2026 was about 14 times that of the same period in 2025; operating loss exceeded $80 billion (adjusted) in the first half of 2026; cash balance of $114 billion; computing commitments exceeded $650 billion; top five customers accounted for 25% of total revenue |
| OpenAI | Competitor | Increased market share, leading to slower revenue growth for Anthropic | No specific data provided in the original text |
| Broadcom | Supplier | One of the computing commitment suppliers | Commitment amount of $161.2 billion (compiled from the original chart) |
| Supplier | One of the computing commitment suppliers | Commitment amount of $114.5 billion (compiled from the original chart) | |
| Amazon | Supplier | One of the computing commitment suppliers | Commitment amount of $110 billion (compiled from the original chart) |
| Microsoft | Supplier | One of the computing commitment suppliers | Commitment amount of $45 billion (compiled from the original chart) |
| SpaceX | Supplier | One of the computing commitment suppliers | Commitment amount of $120.5 billion (compiled from the original chart) |
| Niscale | Supplier | One of the computing commitment suppliers (spelling from original chart) | Commitment amount of $44.6 billion (compiled from the original chart) |
| Lambda | Supplier | One of the computing commitment suppliers | Commitment amount of $41.3 billion (compiled from the original chart) |
| Facebook (Meta) | Historical case | The author used Facebook's 2012 IPO as an example to illustrate that a stock may first be overvalued and then become cheap | IPO price of $36 in June 2012, fell to $18 three months later |
| Alphabet | Author's holding | The author stated they hold Alphabet stock, as an investor in dual-class structure companies | No specific data provided in the original text |
| Meta | Author's holding | The author stated they hold Meta stock, as an investor in dual-class structure companies | No specific data provided in the original text |
Note on the total: The original text states that total computing commitments exceed $650 billion, which is the author's summary of supplier commitment amounts. However, the original text does not provide a complete list of all suppliers and their amounts, so it cannot be confirmed whether the sum of the visible items in the table equals that total. This table merely reproduces the total and scope already present in the original text.